A European Ice Age is Coming Sooner Than We Thought...


Channel: RealLifeLore
Uploaded by RealLifeLore on 20260529
Categories: Education
Tags: real life lore, real life lore maps, real life lore geography, real life maps, world map, world map is wrong, world map with countries, world map real size, map of the world, world geography, geography, geography (field of study), facts you didn’t know
Try Rocket Money for free: https://RocketMoney.com/reallifelore Please subscribe: https://www.youtube.com/channel/UCP5tjEmvPItGyLhmjdwP7Ww RealLifeLore on Facebook: https://www.facebook.com/RealLifeLore/ Select video clips courtesy of Getty Images Select video clips courtesy of the AP Archive Special thanks to MapTiler / OpenS

This detailed summary outlines the scientific evidence, historical context, and potential catastrophic consequences of a collapse of the Atlantic Meridional Overturning Circulation (AMOC), as presented in the video "A European Ice Age is Coming Sooner Than We Thought..." by RealLifeLore.

The Misconception of Latitude and Europe's Mild Climate

A common misconception is that Europe and North America share similar climates because they are at roughly the same latitude. In reality, Europe is situated much furth
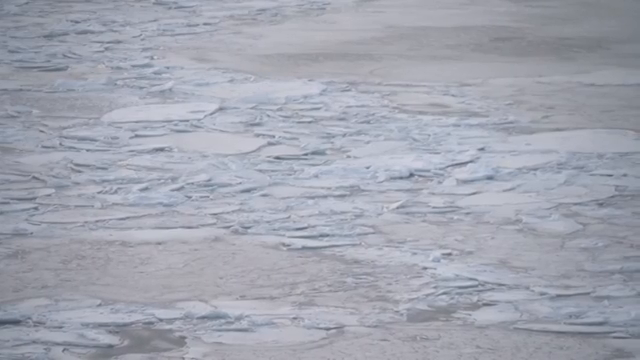
Image for chunk 1

er north than most realize. If cities were aligned strictly by latitude:

Denver, Chicago, Detroit, and New York would align with Italy.

Calgary and Edmonton would lie between Germany and Britain.

Budapest, Munich, Paris, Berlin, Amsterdam, and Dublin would align with Canada.

Helsinki, Oslo, and Reykjavik would sit in the far north of Canada.

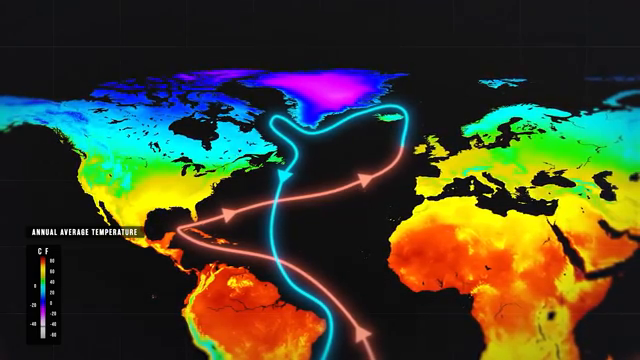
Despite its high latitude, northwestern Europe enjoys a remarkably mild climate compared to its North American counterparts. This is entirely due to a massive ocean cur

Image for chunk 2

rent system.

What is the AMOC?

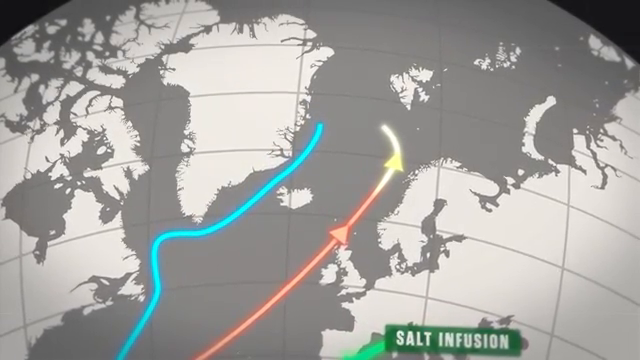
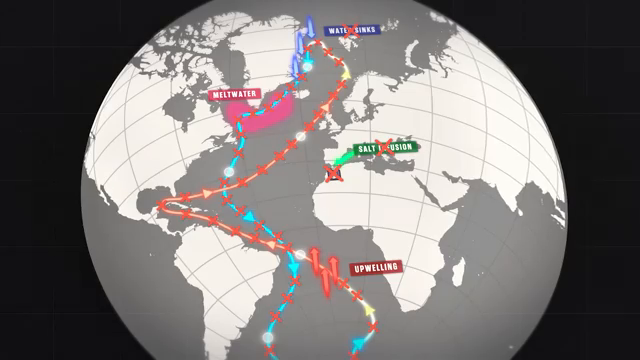
The Atlantic Meridional Overturning Circulation (AMOC) acts as a colossal global conveyor belt driven by differences in water density, which is determined by temperature and salinity.

[North Atlantic (Near Greenland)]

▼ (Water cools, forms sea ice, leaves salt behind)

[Cold, Salty Deep Water Sinks]

▼ (Flows South along ocean floor)

[South Atlantic (Near Antarctica)]

▼ (Upwelling driven by westerly winds)

[Surface Water Flows Nort

Image for chunk 3

hwest]

▼ (Warms in tropics / Gulf of Mexico)

[Gulf Stream Flows Northeast toward Europe] ──► (Brings warmth to Northwest Europe)

└────────────────────────────────────────┘ (Cycle repeats)

Without the warm water pulled from the Gulf of Mexico, northwestern Europe would be as naturally frigid as comparable Canadian latitudes like Labrador or Nunavut.

The Threat of AMOC Collapse

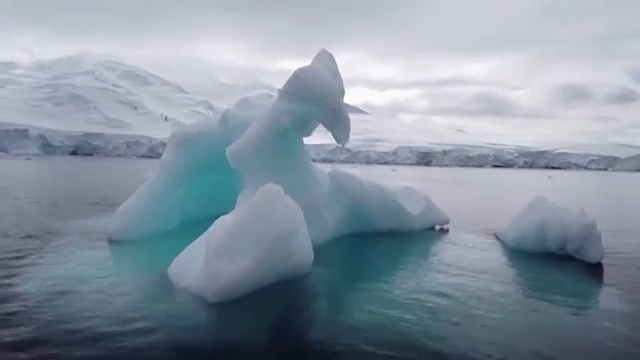
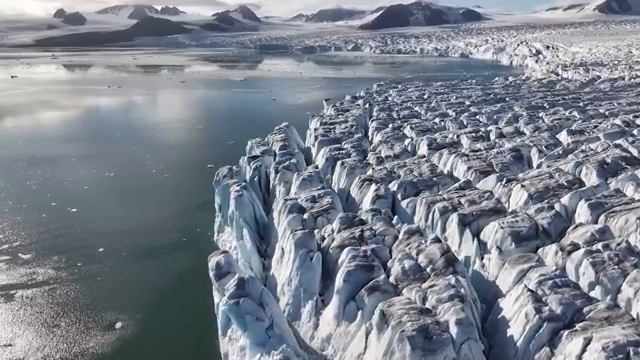
Due to global climate change, the Greenland ice sheet is melting at an accelerated rate, dumping mass

Image for chunk 4

ive amounts of fresh water into the North Atlantic.

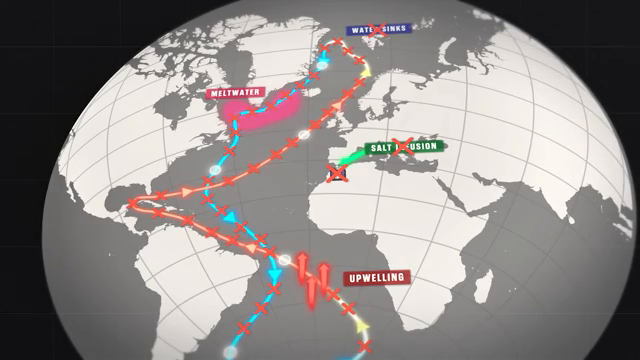
The Feedback Loop: The addition of fresh water dilutes salinity levels, while rising atmospheric temperatures warm the surface water. Because warmer, fresher water is less dense, it loses its ability to sink. This slows the deep-water current, which in turn weakens the AMOC's ability to pull warm tropical water north, perpetuating a dangerous destabilization loop.

The Tipping Point: Scientists warn that the AMOC faces an uncertain tipping point. Once cross

Image for chunk 5

ed, the system will not recover for centuries—even if carbon emissions are entirely reversed—because a single water molecule takes hundreds to thousands of years to complete the entire loop.

Tracking the Decline

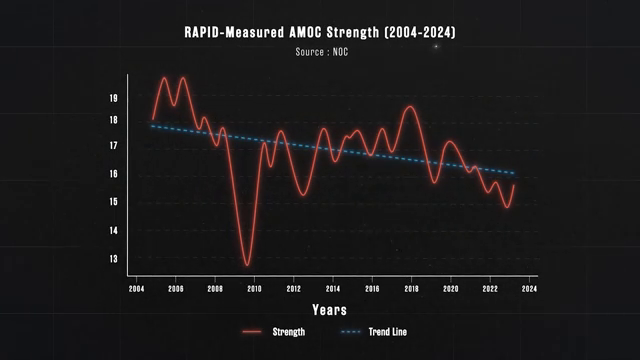
Oceanographers measure the strength of the AMOC in Sverdrups (Sv), where 1 Sv equals 1 million cubic meters of water per second.

Historically regarded as a minuscule risk, modern observation networks like the Rapid Array (launched in 2004 with 24 subsurface moorings spanning the Atlantic between the

Image for chunk 6

Bahamas and the Canary Islands) have provided concrete data:

AMOC Flow Strength Trend (2004–2020)

20 Sv ┼───────────────────────────────

│ ~18-19 Sv (2004-2008)

15 Sv ┼ \ _ _ _ _ _ _ _ _ _

│ \ ~15-17 Sv (2011-2020)

10 Sv ┼ \────────

5 Sv ┼─────────────────────────────── (CRITICAL SHUTDOWN PHASE: ≤ 6 Sv)

└─┬──────────┬──────────┬───────

2004 2010 2020

Data indicates that the AMOC has been weakening b

Image for chunk 7

y an average of 1 Sverdrup per decade since 2004. Scientists estimate they will need at least 29 years of continuous data (until roughly 2033) to definitively distinguish whether this decline is human-driven or part of a natural cycle. A primary real-world warning sign is the "Cold Blob" off the coast of Greenland—the only part of the world's oceans that has actively cooled since the Industrial Revolution.

Scientific Debate & Timelines

Different scientific bodies and studies project highly varied timelines

Image for chunk 8

for a potential shutdown:

IPCC (2021 Report): Predicts a 24% to 39% weakening by 2100 but maintains medium confidence that an outright collapse will not happen before the end of the century.

Criticism of IPCC Models: Leading experts point out that the IPCC models omit the massive volumes of fresh water from the Greenland ice sheet to save computational power, making their outlook overly optimistic.

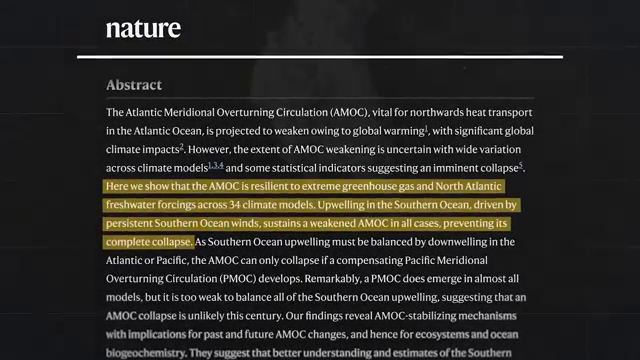
Ditlevsen Study (2023): Suggests an AMOC collapse could occur anywhere between 2037 and 2110 if global emissio

Image for chunk 9

ns continue to rise.

Stefan Rahmstorf (Potsdam Institute): Analyzing models extended to the year 2300 under high-emissions scenarios, he notes the risk of collapse rises to 70%, most likely occurring in the early 2200s. He recently updated his personal estimation of a collapse from a 5% chance to a 50/50 probability. In November 2025, Iceland officially designated an AMOC shutdown as a national security threat.

University of Bordeaux Study (2026): Concluded the AMOC could weaken by 50% from pre-industrial l

Image for chunk 10

evels by 2100, crossing the critical tipping point and triggering an inevitable collapse early in the 2200s.

Historical Precedent: The Younger Dryas

An AMOC shutdown has happened before. Around 12,000 years ago, at the end of the last ice age, melting North American and European ice sheets dumped fresh water into the Atlantic and halted the current.

This triggered the Younger Dryas period, lasting 1,000 years. It caused rapid, drastic cooling over a few decades:

Europe: Decreased by 5°C

North America: Decre

Image for chunk 11

ased by 3°C

Greenland: Decreased by 10°C

Southern Hemisphere: Experienced simultaneous warming.

Projected Consequences of a Modern Collapse

While not as instant as portrayed in Hollywood films like The Day After Tomorrow, a collapse within the next century would severely alter the globe:

Impacts on Europe

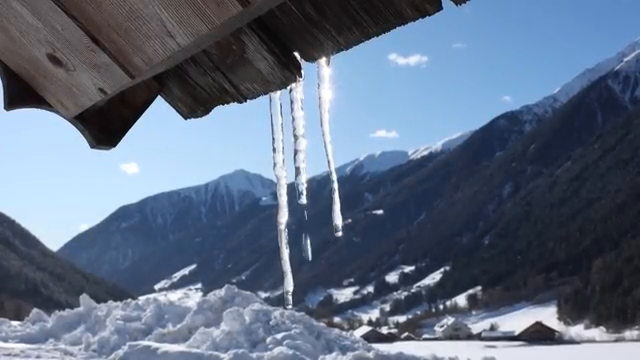
Harsh Winters: Winter temperatures will plummet drastically. London could see extreme lows of -20°C, Edinburgh -30°C, and Oslo's average winter temperature could drop by 15°C, facing extremes of -48°C (res

Image for chunk 12

embling Siberia). Energy grids will face immense strain.

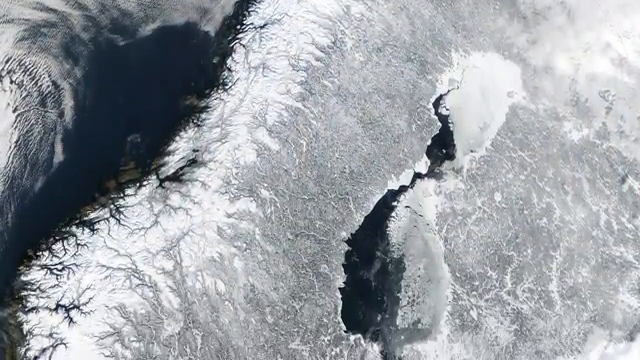
Massive Sea Ice Expansion: By February, winter sea ice would envelop the Baltic Sea and nearly the entire North Sea, stretching down to Denmark, Scotland, the northern Netherlands, and parts of Great Britain. Countries would have to invest heavily in massive icebreaker fleets to maintain maritime trade.

Agricultural Collapse: Drastically reduced precipitation will dry out northwestern Europe. Rain-fed arable agriculture would become virtually impossib

Image for chunk 13

le in the UK and Ireland, collapsing their food production.

Extreme Seasons & Storms: Summers will remain relatively warm, creating volatile temperature swings between seasons. The thermal gradient between a freezing northern Europe and a warming southern Europe will widen by 4°C, drastically intensifying storm systems across the continent.

Global Impacts

Antarctic Warming: Because cold water is no longer pulled north, Antarctica could warm by an astonishing 6°C, severely accelerating ice sheet melting and

Image for chunk 14

global sea level rise.

US Coast Sea Level Rise: The cessation of the current pulling water away from North America will cause sea levels to rise swiftly along the US East Coast.

Shifted Climate Belts: The tropical rain belt will shift south, causing the rainy and dry seasons in the Amazon to flip, increasing drought in the African Sahel, and weakening the monsoon seasons in Asia.

Video Link: https://www.youtube.com/watch?v=VkYWW95eSLs

A European Ice Age is Coming Sooner Than We Thought...

RealLifeLore · 1.2

Image for chunk 15

Viewer Discussion & Comments

@ryback1911
Watching this Video at nearly 40°C in Germany is a bit hilarious.
@trillionbones89
FROSTPUNK is coming before GTA 6
@saad_ghannam
I know I can always depend on RLL for my weekly cortisol spike
@bond0815
Pointing out that New York is roughly at the same latitude as Rome is indeed something a lot of people dont understand here in Europe as well.
@matiaskekki2998
My goat placing the ad in the ending. Watched through out of respect