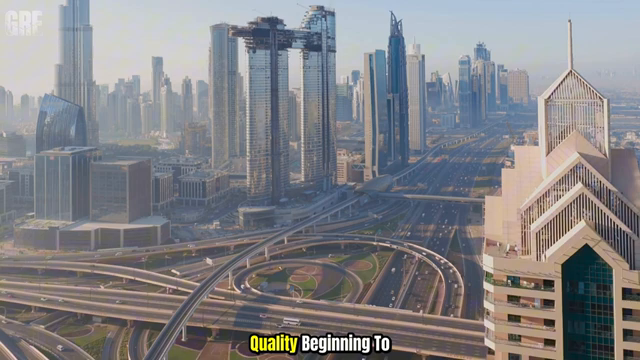
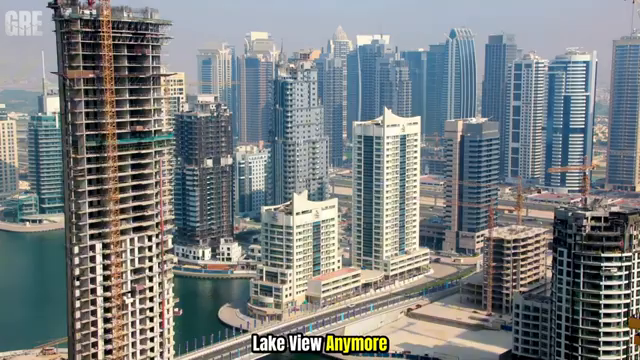
Broken DUBAI: 10 Areas Turning Into Ghost Zones as Tourism Collapses in 2026


Channel: Global Reality Explained
Uploaded by Global Reality Explained on 20260712
Categories: People & Blogs
Tags: traveldocumentary, global documentary, global economic crisis, global crisis, travel documentary, dubai, singapore, travel, tourism, Dubai, UAE, Dubai tourism, Visit Dubai, Dubai travel, Dubai 2026, Dubai economy, Dubai real estate, Dubai ghost town, Empty Dubai, Dubai hotels, Dubai attractions, Dubai vacation, UAE tourism, Middle East travel, Luxury Dubai, Dubai crisis, Ghost cities, Travel documentary, Urban exploration
What is really happening across Dubai in 2026? From quieter neighborhoods to changing visitor patterns, this documentary explores why some people believe parts of Dubai are becoming unusually empty and what these changes could mean for the future of the UAE. Rather than making assumptions, we examine trends surrounding Dubai touri

Based on the video titled "Broken DUBAI: 10 Areas Turning Into Ghost Zones as Tourism Collapses in 2026", here is a highly detailed structural and statistical overview of the content presented.

1. Core Economic Framework & Overview

The video analyzes a systemic downturn affecting Dubai's real estate, corporate infrastructure, and luxury sectors during the first half of 2026. The crisis is attributed to several macroeconomic and geopolitical headwinds:

Revenue Plunge: Real estate transaction revenue plummeted sharply from its peak
Image for chunk 1

of 917 billion AED in 2025 down to just 55.18 billion AED in January 2026 [00:14].

Corporate Exodus: Over 780 multinational corporations (including consulting giants like McKinsey, BCG, Bain & Company, and Deloitte) relocated their regional headquarters to Riyadh, Saudi Arabia, driven by the Kingdom's Regional Headquarters (RHQ) decree [00:30, 17:37].

Geopolitical Fractures: A Gulf security incident involving drone debris from the Iran conflict in early March 2026 severely impaired Western tourist confidence [02:04, 04:46].

Regula

Image for chunk 2

tory & Capital Constraints: Anti-money laundering regulations tightened locally, combined with stringent capital controls from China, halting speculative investments [08:21].

2. Regional Breakdown and Performance Metrics

Below is a detailed analysis of the 10 specific zones highlighted in the video:

I. Jumeirah Beach Residence (JBR)

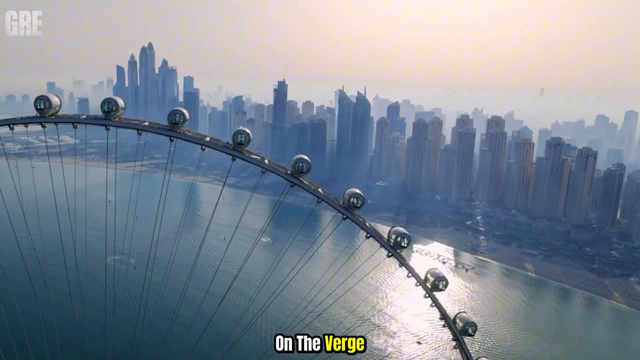
Key Issues: Technical failure of the 250-meter-tall Ain Dubai ferris wheel due to foundation issues on the artificial island's weak soil [01:27, 01:51]. The safety certificate was revoked by the German

Image for chunk 3

TUV association [01:35].

Financial Impact: Luxury seaside restaurants experienced a 45% drop in Q2 2026 revenue [02:13].

Market Data:

Vacancy Rate: 45% [02:34]

Property Values: Sunk to 1,850 AED/sq. ft. [02:34]

Secondary Market Loss: 15% to 20% [02:45]

II. Palm Jumeirah

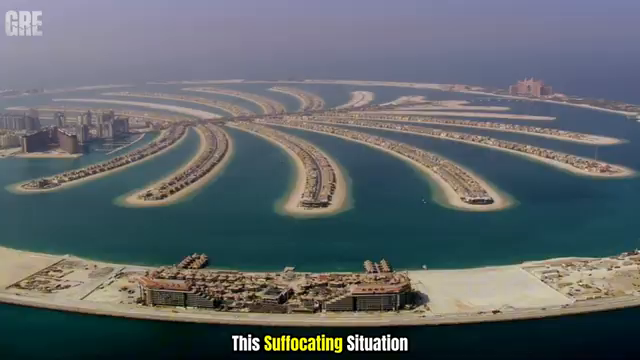
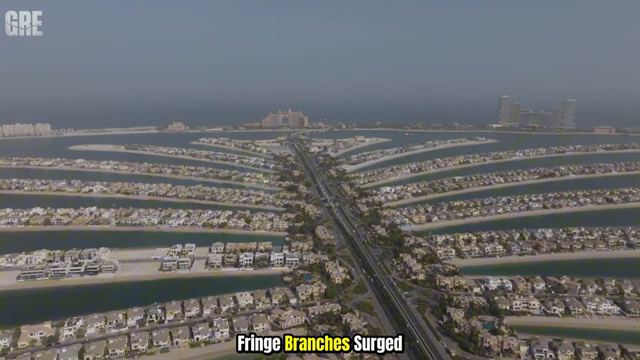
Key Issues: The 11 km crescent breakwater stopped natural currents, causing narrow channels to take 13 days to circulate water, generating toxic algae blooms and foul odors [04:05]. The island experiences natural soil subsidence of 5 mm per year [04:27]. Capital m

Image for chunk 4

igrated inland to Emirates Hills [04:54].

Market Data:

Rental Yield: Dropped to 2.5% [05:01]

Secondary Market Loss: 10% to 15% [05:01]

III. Jumeirah Village Circle (JVC) & Jumeirah Village Triangle (JVT)

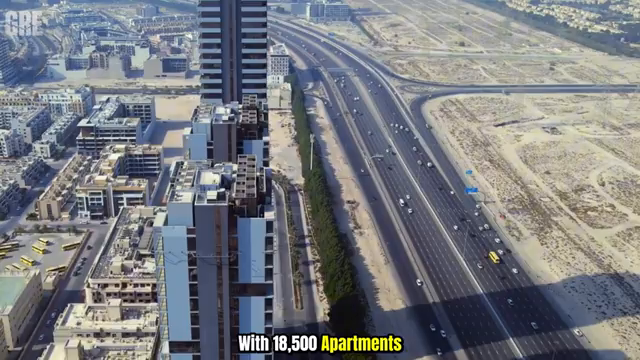
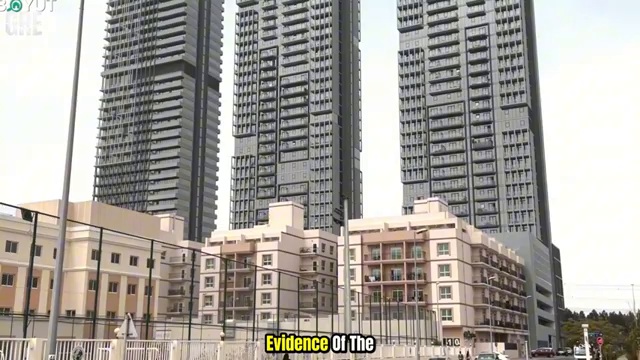
Key Issues: A massive wave of 18,500 apartment handovers scheduled for 2026–2027 (74% being studio and 1-bedroom units) oversaturated the mid-budget sector [05:56]. Lack of metro connection and an 18% surge in maintenance fees led to mass tenant departure [06:16].

Market Data:

Vacancy Rate: 58% [06:45]

Price Slashing: 20% to 25% d

Image for chunk 5

rops via desperate fire sales [06:50]

IV. Downtown Dubai

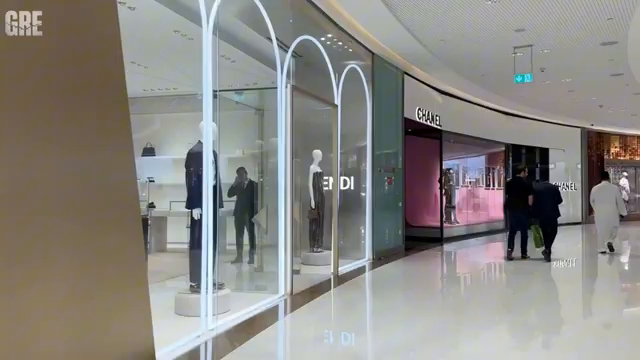
Key Issues: Desolation around the Burj Khalifa Square and Dubai Mall [07:49]. Reversal of Russian capital influx (which previously drove up prices by 44% in 2022–2023) due to banking restrictions [08:04]. Luxury brands are actively downsizing retail footprints [08:36].

Market Data:

Vacancy Rate (Ultra-Luxury Apartments): 35% [08:49]

Average Transaction Value: 2,200 AED/sq. ft. [08:49]

Secondary Market Loss: 10% to 12% [09:00]

V. Business Bay

Key Issues: Mass vacancy of Class

Image for chunk 6

A commercial office spaces following the corporate exodus to Riyadh's KAFD complex [10:02, 10:22]. The area suffered a double-dip recession as 9,400 new residential units hit the market simultaneously [10:30].

Market Data:

Combined Office/Apartment Vacancy Rate: 48% [10:30]

Rental Yield: 3.8% [10:36]

Secondary Market Loss: 15% to 18% [10:36]

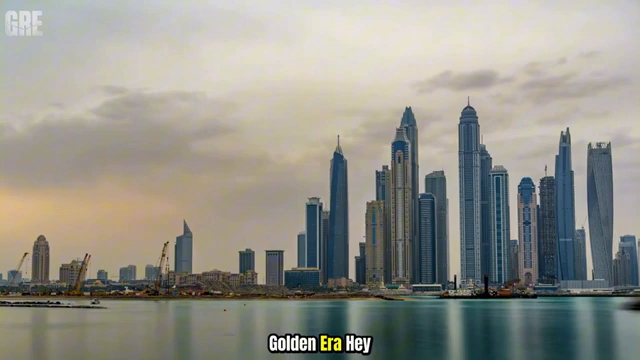
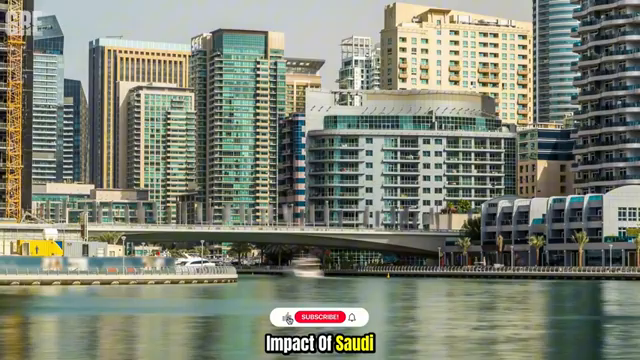
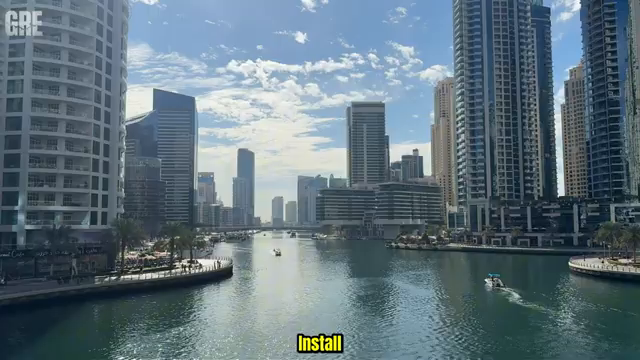
VI. Dubai Marina

Key Issues: Strict legal crackdowns by the Ministry of Economy and Tourism required mandatory SIRA smart lock installations [11:52]. New operational burdens and taxes consume

Image for chunk 7

d 19% of total revenue alongside a 100,000 AED fine policy for noise violations [11:59]. Short-term units flooded long-term markets causing severe saturation [12:20].

Market Data:

Vacancy Rate: 42% [12:45]

Net Annual Income Drop: From 160,000 AED down to 105,000 AED per unit [12:28]

Secondary Market Loss: 18% to 22% [12:45]

VII. Jumeirah Lakes Towers (JLT)

Key Issues: Lake D was completely drained, exposing black algae mud emitting severe odors [13:28]. Stagnant waters caused high internal apartment humidity and structural mold is

Image for chunk 8

sues across the 87-tower complex [13:41]. Retail sectors suffered from a 40% drop in international visitors [14:16].

Market Data:

Rental Yield: 3.2% [14:32]

Secondary Market Loss: 15% average cut [14:32]

VIII. Meydan City

Key Issues: Desertification of mega-projects; the massive Meydan One Mall development was terminated due to resource redirection to Dubai Hills Mall [15:44]. Liquidity crises forced major contractor ASGC to halt construction, and land was confiscated by RERA from failing developers [15:59].

Market Data:

Vacancy R

Image for chunk 9

ate: 60% [16:19]

Rental Yield: 2% [16:19]

Secondary Market Loss: 25% to 30% [16:25]

IX. Dubai International Financial Centre (DIFC)

Key Issues: The 7 billion AED expansion project (DIFC Square and Zabeel) stalled [17:22]. Michelin-starred retail environments and premium office infrastructures lost their target demographic of high-earning experts to Saudi Arabia [17:45].

Market Data:

Expanded Sector Vacancy Rate: 44% [18:01]

Secondary Market Loss: 10% to 15% [18:01]

X. The World Islands

Key Issues: Extreme logistical failure across

Image for chunk 10

the 300 artificial islands [19:00]. Missing mainland connections mean structures run entirely on noisy diesel generators; waste/sewage infrastructure has stalled [19:24]. Protracted legal battles with Nakheel and canceled tourist ferry links have isolated the project [19:40]. Floating Seahorse villas are actively rusting and accumulating sand [19:16].

Market Data:

Vacancy Rate: 92% [20:04]

Asset Value Capital Loss: 40% to 50% [20:04]

3. Data Visualizations (ASCII Models)

A. Comparative Vacancy Rates by District (2026)

Plaintext

D

Image for chunk 11

istrict Vacancy Rate (%)

-------------------------------------------------------------------------

The World Islands [=======================================] 92%

Meydan City [=========================] 60%

JVC / JVT [========================] 58%

Business Bay [====================] 48%

JBR [===================] 45%

DIFC (Expanded) [===================] 44%

Dubai Marina [==================] 42%

Downtown Dubai

Image for chunk 12

[==============] 35%

-------------------------------------------------------------------------

B. Real Estate Capital Asset Losses (Secondary Market Price Drops)

Plaintext

0% -10% -20% -30% -40% -50%

|=============|=============|=============|=============|=============|

[- Downtown (10-12%) ]

[--- DIFC (10-15%) --]

[--- Palm Jumeirah (10-15%) ]

[--- JBR (15-20%) ---]

[-- Business Bay (15-18%) ]

Image for chunk 13

[--- Dubai Marina (18-22%) --]

[--- JVC/JVT (20-25%) ---]

[---- Meydan City (25-30%) ----]

[-- World Is. (40-50%) --]

C. Market Yield Performance Compressed Against Maintenance Barriers

Plaintext

5.0% +

|

4.0% + o Business Bay (3.8%)

|

3.2% + o JLT (3.2%)

|

2.5% + o Palm Jumeirah (2.5%)

|

2.0% +o Meydan City (2.0%)

+------------------

Image for chunk 14

--------------------------

4. Conclusion & Key Takeaway

The video concludes that Dubai's 2026 economic state is a fundamental correction rather than a sudden event [20:48]. The unsustainable growth model—heavily reliant on speculative virtual asset values and paper-based off-plan purchasing—is collapsing as capital shifts toward tangible cash flows, real domestic demand, and alternative regional financial markets [20:28, 21:15].

Broken DUBAI: 10 Areas Turning Into Ghost Zones as Tourism Collapses in 2026

Global Reality Explained ·

Image for chunk 15

Viewer Discussion & Comments

@JascharJames
I never understood the attraction of Dubai. Hot and sterile. No history. No personality. Authoritarian. Very expensive. Why?
@gonzaloleon-gelpi9776
I don't even want to spend a minute in the Arabian Peninsula.
@AmoriMuHaira13
Never ever i want to live in a articificial glass city where temp are scorching hot. No fauna no flora just immense glass towers and desert. and artificial parks. I PASS .
@Leneskyvalagar-p5z
I DON'T GIVE A FOOOOK ...MAY THE DESERT RECLAIM IT!!!!
@davidascher1801
How can anyone find this desirable, to me it's just an expensive cat box in the desert.